Invertebrate Concept Maps
~ extra-credit assignment and study aid ~
Click here for a .pdf version of this page
|
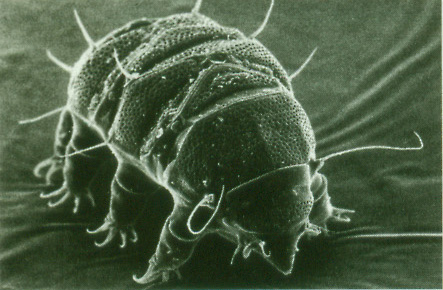
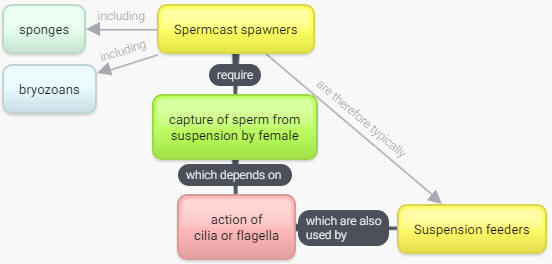
Biology of Invertebrates is full of detailed information but is also rich with connections among pieces of information that can ultimately emerge into a more conceptual framework for how organisms are built and how they work. As one small example, recognizing that spermcast spawners require a mechanism for capturing sperm, and therefore are largely restricted to animals that suspension feed, makes a fundamental connection between reproductive and feeding systems in sponges as well as among other spermcast spawning/suspension feeding organisms. Throughout the course I will be giving you many bits of information and asking you to make such connections to build your web of understanding of the functional design of animals. One way to organize such information is in a concept map, which shows relationships between terms or concepts by connecting them using descriptions of those relationships. Developing such a map can be a fun, challenging, creative, and illuminating way to develop common themes and see the bigger picture—that is, a good way to visualize, synthesize, and retain information for exams. Your goal is not necessarily to produce a beautiful product but rather to capture information, work through the process of connecting it into concepts, and uncover your own understandings and misconceptions. For this optional assignment you have complete freedom to create your own concept maps. My suggestion would be to create several maps that capture different functional systems (e.g., feeding, movement, defense, reproduction). You can work on your maps alone or collaborate with one other student—the software I will recommend allows you to collaborate on the same map (though not at the same time). I don’t have any preconceived ideas about what you could produce, and the possibilities are limitless. Constructing your ICM in Bubbl.us You can construct your concept map using the free online software Bubbl.us (http://bubbl.us) (or you can use anything else that allows you to achieve these goals). Here is an example of what Bubbl.us can produce using the example described above:
Note that I chose to put functional groups in yellow, processes in green, taxa in blue, and structures in red. Every connection between terms uses linking words that help to complete a sentence. As you accumulate more information you can add bubbles to your concept map, reshape it to include new connections and new taxa, and help you to uncover connections. Concept maps are a great way to study because of the connections they make clear.
The free version of the software gives 3 maps to each person (so you have a total of 6 bubbles if collaborating). If you run out of maps, you can always do two different diagrams on one map page.
Here is how I suggest you proceed:
Extra credit! To gain your extra credit you must show me your progress before each exam. I am willing to add up to 3.33% to your final course grade in extra credit (the actual amount depends on your effort on this assignment and will range widely). To put this into perspective, 3.33% is worth more than 1/2 of the points on your first laboratory practical exam, and would be a full jump in letter grade level (e.g., from B+ to A-). Because the credit is added after the final curve, it can bump up anyone’s grade. More importantly, if done effectively, reinforcing the course information in this way can raise your grade on exams as well.
The first time I tried this, I was very impressed with the results. I received many different designs that appeared to reflect different ways of organizing the information. I am eager to see what you come up with. Instead of taking notes on your notes, make a concept map! Feel free to share it with me for a consultation at any time. |